
The term “debugging” indicates that it involves eliminating or getting rid of “bugs” and errors in the code. Debugging is a crucial step in building software that involves identifying and resolving the bugs in the software’s source code. Debugging can be challenging and time-consuming, especially when working with complex programs or dealing with new/ unfamiliar technology.
However, it is a crucial skill for a developer to master debugging and ensure that the code is completely functional in the final product. As a result, in this article, I will share my insights on debugging front-end web apps.
While my main focus will be on front-end development if you are from other development fields, I believe you will find this article relatable in many cases.
Identifying the problem
The first rule of debugging is to identify the problem. It is impossible to proceed without identifying the bugs/errors in the code. So, your first step would be to identify the problem.
After identifying the issue, you must analyze the error or bug that has appeared. For example, why a div is not centered or if you are fetching some data using an API call. Once data is fetched you have mapped that data in a component to display on the browser in a structured manner. When you run the code in the browser, you see nothing displayed on the webpage.
You can investigate, by asking the following questions yourself:
-
Is this a styling issue?
-
Does this bug/error occur on every device?
-
Does this bug/error occur on every browser?
-
Does this bug/error occur in this browser version only?
-
Does the data being fetched from the API?
-
Is the data logged in the console?
-
Does the API endpoint work properly?
This is how you should ask yourself and review the code. While testing your website, you should test it on a minimum of two to three different most used browsers (Google Chrome, Safari, or Firefox) by the users. This helps in preventing any bugs/errors that might occur on different browsers and devices and results in a better user experience.
In front-end development there are majorly two types of debugging:
-
CSS debugging
-
Javascript debugging
First, let’s talk about CSS debugging…
CSS Debugging
Even though there are numerous developer tools for CSS debugging available online, it can be painful and complex, and it can hit you over the head like a hammer.
Here, I will share with you the only solution resulting in super simple debugging is to use the outline property in CSS which creates an outline around the selected div/container.
*{
 outline: 1px solid red;
}

.container{
 outline: 1px solid cyan;
}
You can even use the border property if you have specified box-sizing: border-box. I prefer you to use an outline as it doesn’t shift the position of the elements. For more, better debugging you can add a background to the container.
Another, important aspect to keep in mind while debugging css code is to test the design in every viewport by resizing the different viewports. To test the webpage in different viewports:
-
Open the Developer Tools on the browser
-
Select Toggle Device Tool Bar
-
and press CMD + Shift + M or Ctrl + Shift + M
-
or click the mobile phone icon on the top left corner of the Developer Tools window.
Chrome or any other modern browser supports this feature so you don’t need to install any other browser to access this feature. This will help in viewing your website’s responsiveness or any other styling in different viewports.
Hence, resulting in simple and easy debugging.
Javascript Debugging
In Javascript, there are lots of methods for debugging. But here in this article, I will share with you five important debugging methods that can save you time.
-
console.log(): It is a highly effective way to debug your code as errors or bugs can make it difficult to pinpoint where the problem is.
By using console.log() to display the data, you can easily locate the issue and debug your code quickly. This method can often complete up to 70-80% of the debugging process, making it unnecessary to try any other debugging methods.
For instance, let’s consider a scenario where we have declared three variables - a, b, and c, where the value of c is obtained by multiplying a and x. However, since the variable x is undefined, this code block will result in an error.
const a = 6;
const b = 8;
const c = a * x // error is here

console.log(c);
The error we get is this inside the console,
Uncaught ReferenceError: x is not defined -
Display the object as a table: When dealing with a complex and complicated set of objects that you want to view. The first thing that comes to your mind is to console.log the object.
But, while working with objects you should try
console.table()method instead ofconsole.log().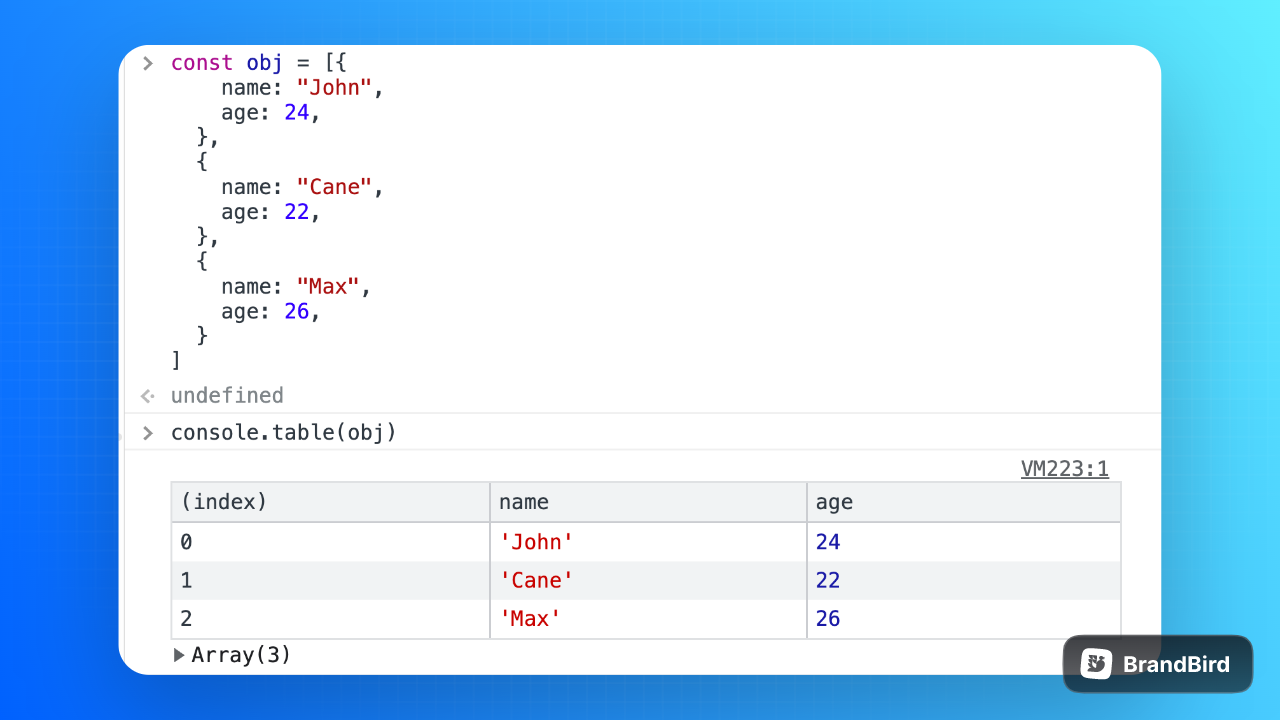
-
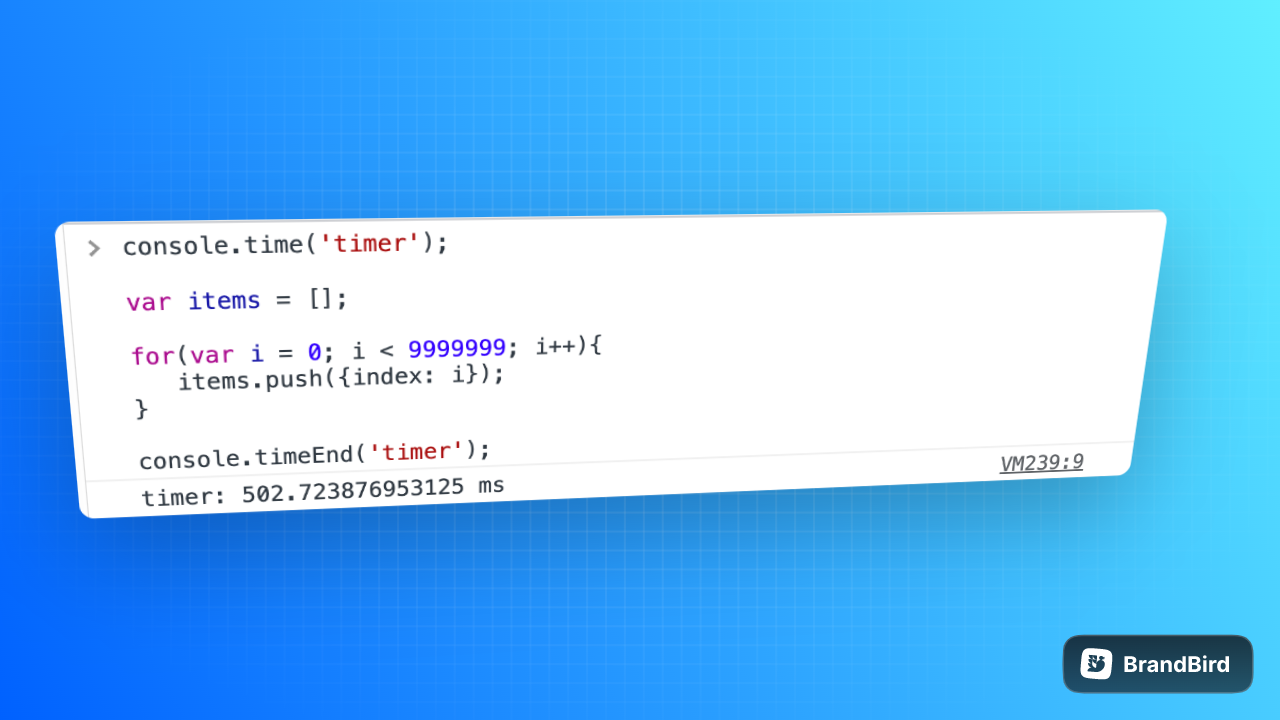
Benchmark Loops: When working with the loops in Javascript, it can be super helpful to know exactly how long a loop has taken time to execute. So, this is how you debug the loops.
-
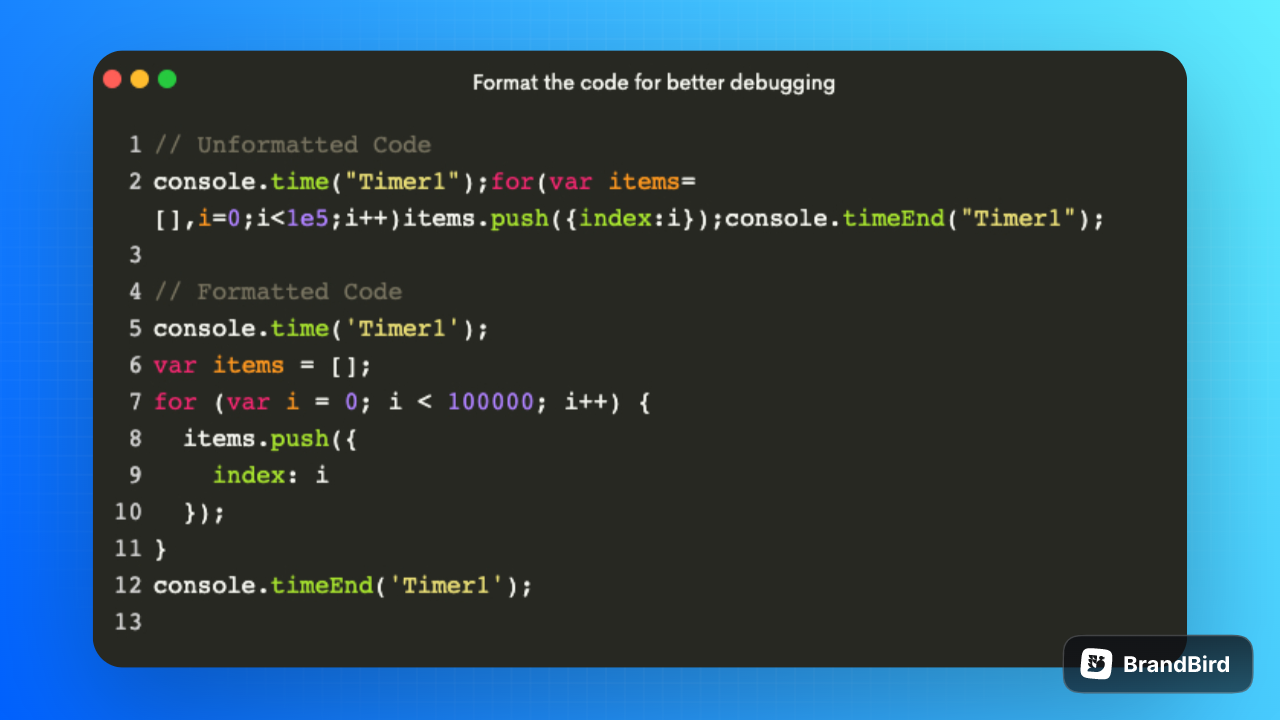
Format the code: During debugging, poor readability can occasionally become a severe problem. Code formatting involves structuring and formatting it with the appropriate indentation, which enhances code readability and, ultimately, debugging. Do not neglect to format the code.
-
Remove unwanted code: Unnecessary code in a file can create problems such as complexity and readability issues, making it more challenging to comprehend. Therefore, it’s important to remove unwanted code from the file to enhance its clarity and simplicity, making it easier to understand and debug.
These are the five important debugging techniques in javascript that can help you debug seamlessly.
Conclusion
In conclusion, debugging is a crucial step in building software that involves identifying and resolving bugs in the software’s source code. Although it can be challenging and time-consuming, mastering debugging is essential for developers to ensure that the code is completely functional in the final product.
When it comes to front-end web apps, identifying the problem is the first rule of debugging. You must analyze the error or bug that has appeared by asking yourself a series of questions. Additionally, testing your website on a minimum of two to three different most used browsers helps prevent any bugs/errors that might occur on different browsers and devices.
In front-end development, there are primarily two types of debugging: CSS debugging and Javascript debugging. CSS debugging can be complex, but using the outline property in CSS is an easy and effective solution. When it comes to Javascript debugging, there are several methods for debugging, including console.log(), displaying the object as a table, benchmarking loops, formatting the code, and removing unwanted code.
Happy Coding!